|
|
使用 GAUSS 25 进行更多研究,减少工作量!
介绍
GAUSS 25 将通过直观的工具进行数据探索、高级诊断和无缝模型比较,从而改变您的工作流程。
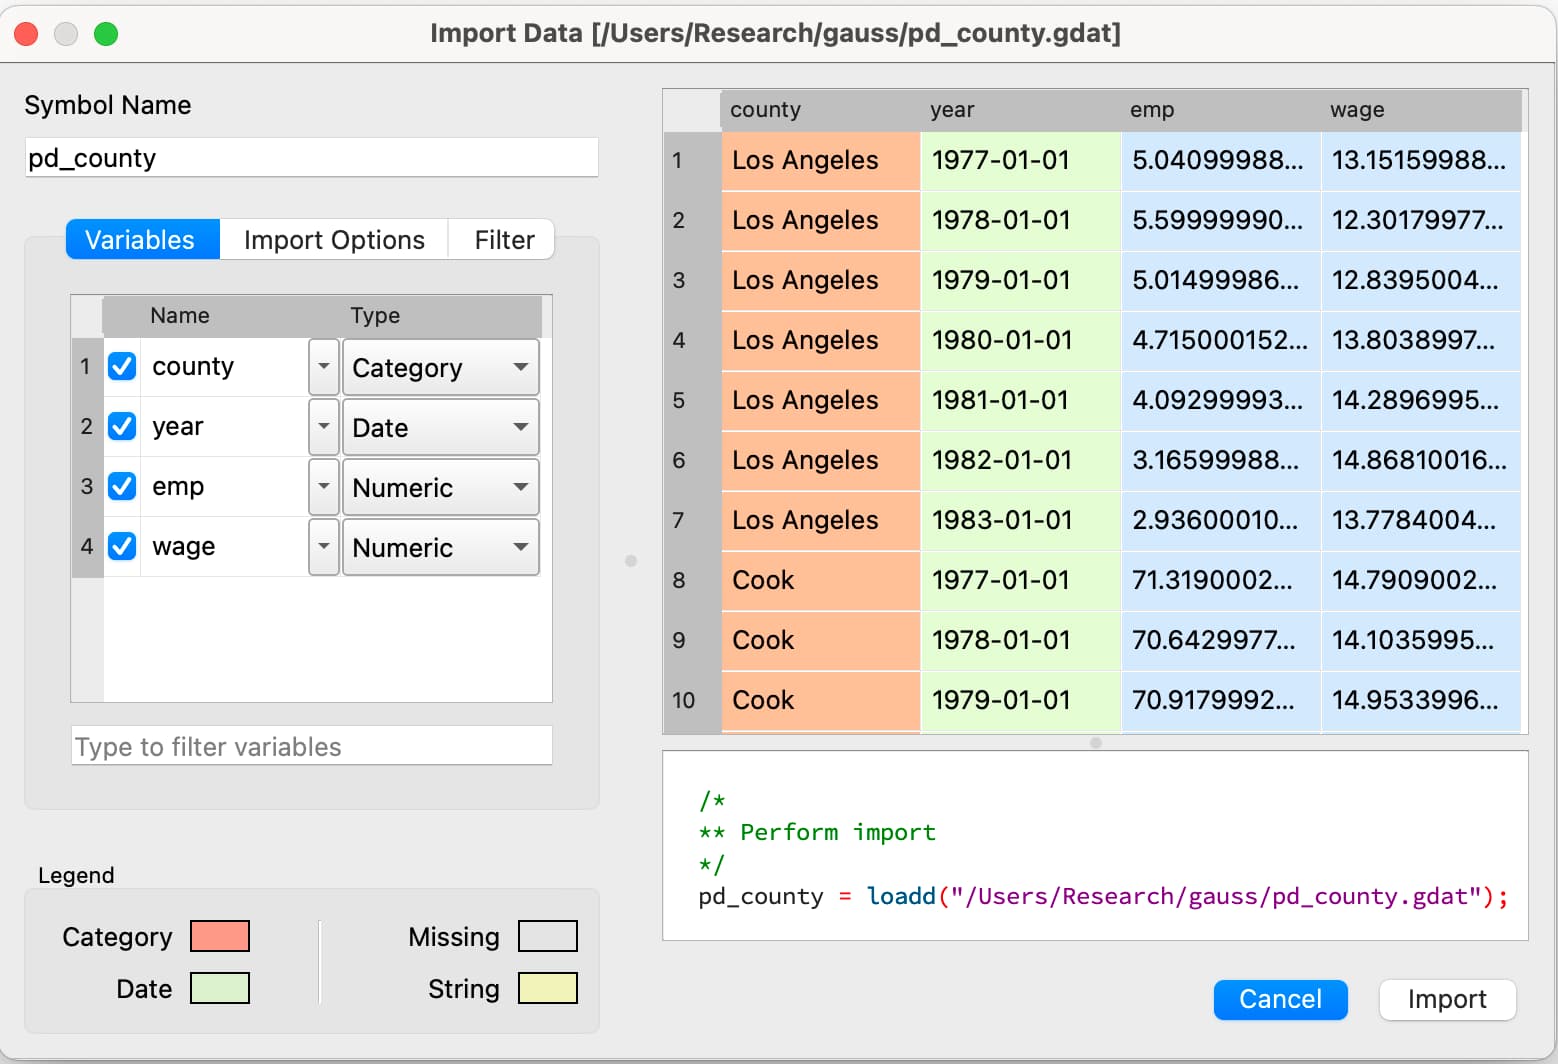
难以理解面板数据?GAUSS 25 改变了您加载、分析和探索数据的方式,为您提供所需的直观工具。
探索面板数据特征
- 使用pdSummary探索整体、组内和组间汇总统计数据。
|
// Import data |
|
pd_cty = loadd("pd_county.gdat"); |
|
|
|
/* |
|
** Create panel data summary report. |
|
** pdSummary will automatically detect |
|
** group variable and time variable |
|
*/ |
|
call pdSummary(pd_cty); |

- 使用pdSize和pdTimeSpans查看面板数据时间分布。
|
// Print report on size and range |
|
// of each individual in the panel. |
|
call pdSize(pd_cty); |

准备建模的面板数据
- 自动智能地检测群组和时间变量,实现无缝的工作流程。
- 使用pdSort根据检测到的组和时间变量立即对面板数据进行排序。
- 新的pdLag和pdDiff用于计算面板数据滞后和差异。
|
// Compute second lag of each |
|
// individual in the panel |
|
pd_cty_l = pdLag(pd_cty, 2); |
|
|
|
// Print the first 10 observations |
|
print pd_cty_l[1:10,.]; |

- 使用pdAllBalanced和pdAllConsecutive检查平衡性和连续性。
新假设检验
新的waldTest程序提供了一个强大而直观的工具来检验估计后的线性假设。
- 在 OLS、GLM、GMM 和分位数回归之后执行后估计假设检验。
- 使用变量名轻松地指定假设。
- 全面支持假设中变量的线性组合。
|
// Run ols model |
|
struct olsmtout cen_ols; |
|
cen_ols = olsmt("census3.dta", "brate ~ medage + medage*medage + region"); |
|
|
|
// Test the hypothesis that the coefficients on |
|
// the Ncentral region and South region are equal |
|
{ wald_stat, p_value } = waldTest(cen_ols, "region: NCentral - region: South"); |

使用新的qfitSlopeTest检查分位数回归后分位数间斜率的等效性。
|
// Set up tau for regression |
|
tau = 0.35|0.55|0.85; |
|
|
|
// Call quantileFit |
|
struct qfitOut qOut; |
|
qOut = quantileFit("regsmpl.dta", "ln_wage ~ age + age:age + tenure", tau); |
|
|
|
// Test for joint equivalency of all slopes |
|
// across all quantiles |
|
qfitSlopeTest(qOut); |

增强的结果打印输出
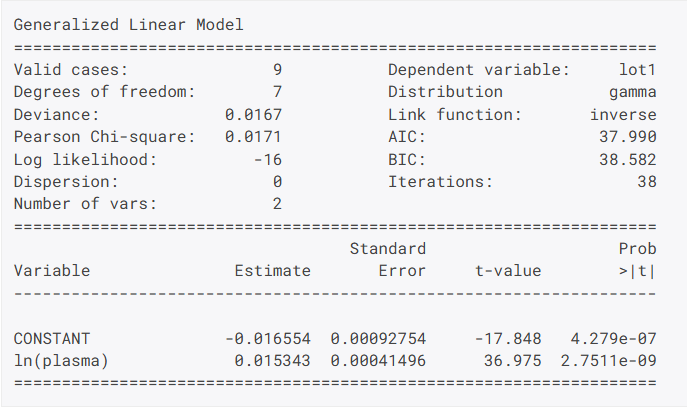
GAUSS 25 现在提供扩展的模型诊断和跨所有估算程序的一致打印输出。
|
//Get file name with full path |
|
file = getGAUSShome("examples/clotting_time.dat"); |
|
|
|
//Perform estimation and print report |
|
call glm(file, "lot1 ~ ln(plasma)", "gamma"); |

这些增强功能使得比较模型、探索结果和获得更深入的见解变得比以往更加容易。
- 使用制表符扩展双向制表符来查找行或列的百分比。
- gmmFitIV函数现在使用来自数据框的元数据来识别和报告变量名称并支持“by”关键字。
- 排序数据的可选规范可在使用计数时提高速度。
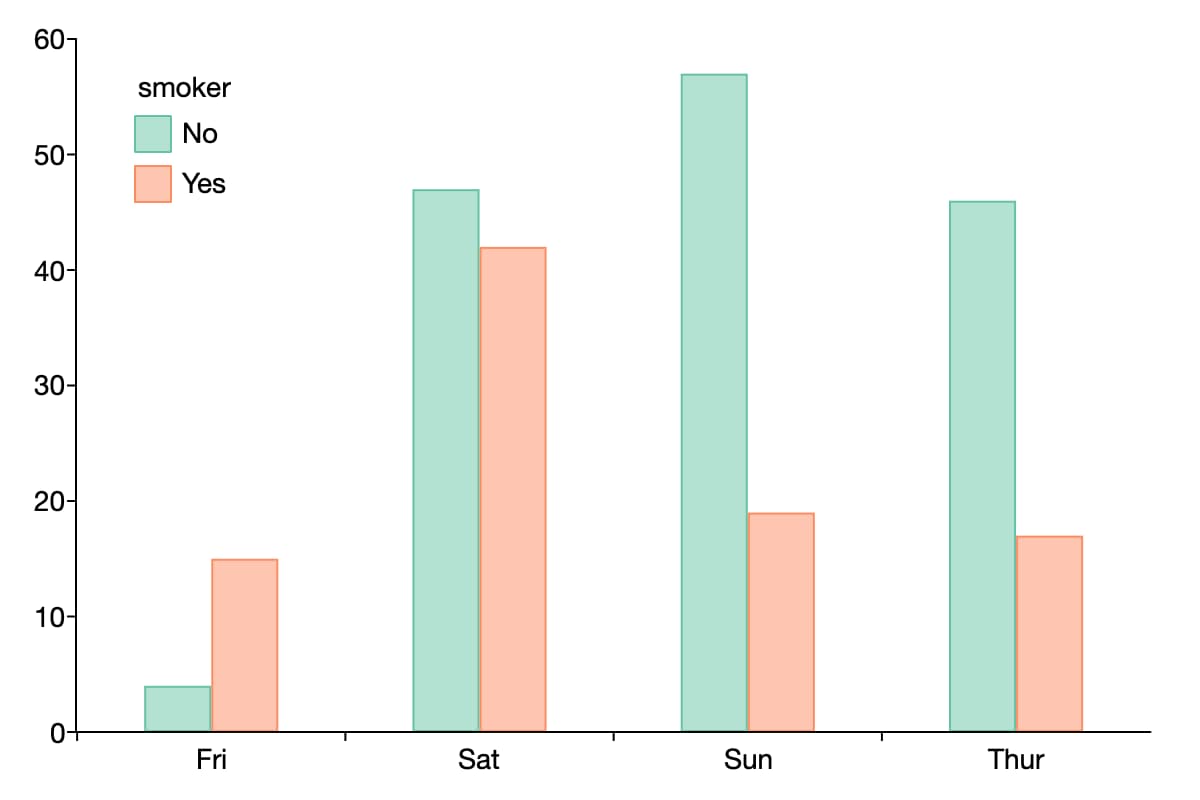
- plotFreq程序现在支持“by”关键字来计算跨组频率。
// Load dataset |
|
tips2 = loadd("tips2.csv"); |
|
|
|
// Create a frequency plot of visits per day |
|
// for each category of smoker (Yes, or No). |
|
plotFreq(tips2, "day + by(smoker)"); |
- 已保存现在会自动检测分类变量和字符串变量,并使用它们的标签将其保存为 Excel 文件。
结论
欲了解 GAUSS 25 的全部优惠列表,请参阅完整的更新日志。
在线留言
尊敬的客户朋友,如您有任何意见建议,请通过下表反馈给我们,我们会尽快与您联系。
|
|
|

